Fitbit Case Study: Activity Volume, Sedentary Time, Sleep, and Calories
Analytical Report
1. Executive Overview
This analysis explores how daily activity patterns relate to sedentary time, sleep, and calories burned using a multi-user Fitbit dataset. The central objective was to move beyond surface-level activity metrics and examine how different forms of movement, particularly overall activity volume and intensity composition, influence behavioural outcomes across a typical day.
Rather than assuming that more intense activity automatically leads to better behavioural outcomes, this study investigates whether total daily movement provides a clearer behavioural signal. The findings indicate that total active minutes are more meaningfully associated with sedentary behaviour than intensity mix alone, and that moderate, consistent movement plays a significant role in reducing sedentary time.
2. Data Source and Scope
The dataset consists of merged daily Fitbit activity, sleep, and weight metrics, with each row representing a single user-day observation. Key variables include VeryActiveMinutes, FairlyActiveMinutes, LightlyActiveMinutes, SedentaryMinutes, TotalMinutesAsleep, Calories, and BMI.
Calories are model-derived Fitbit estimates, making within-person comparisons more reliable than cross-user comparisons. Weight and BMI were sparsely logged and were therefore treated as contextual variables rather than primary analytical drivers. This structure supports a time-budget interpretation of behaviour, where activity, sedentary time, and sleep compete within the same 24-hour cycle.
3. Analytical Approach
The analysis was conducted using Python (Pandas, Matplotlib) within a Jupyter Notebook environment, with initial querying and validation performed through Google BigQuery. Data preparation included confirming one row per user per day, reviewing date coverage, and aligning activity and sleep metrics into a unified analytical dataset.
The analysis proceeded in two stages. First, intensity composition was examined using VeryActiveMinutes, FairlyActiveMinutes, and LightlyActiveMinutes to assess whether intensity mix meaningfully differentiated behavioural outcomes. When this approach showed weak separation, the analysis shifted toward total active minutes per day (VeryActiveMinutes + FairlyActiveMinutes + LightlyActiveMinutes) as the primary behavioural signal.
Three comparative lenses were applied:
– Continuous behavioural analysis (activity volume vs SedentaryMinutes)
– Group-based analysis (low, medium, and high activity volume tertiles)
– Within-person analysis (higher-than-usual vs lower-than-usual activity days)
4. Key Findings
4.1 Light Activity Dominates Daily Movement
Across users, lightly active minutes accounted for the majority of total daily movement. This reduced the usefulness of intensity mix as a primary differentiator, as most users accumulated activity through lower-intensity movement rather than sustained high-intensity exercise.
4.2 Activity Volume Shows a Consistent Inverse Relationship with Sedentary Behaviour
Continuous analysis using total active minutes revealed a clear but moderate inverse relationship with SedentaryMinutes. While the trend is not steep and shows noticeable day-to-day variability, higher activity volume days rarely coincide with extremely high sedentary minutes. This indicates that overall movement across the day provides a more stable behavioural signal than intensity mix alone.
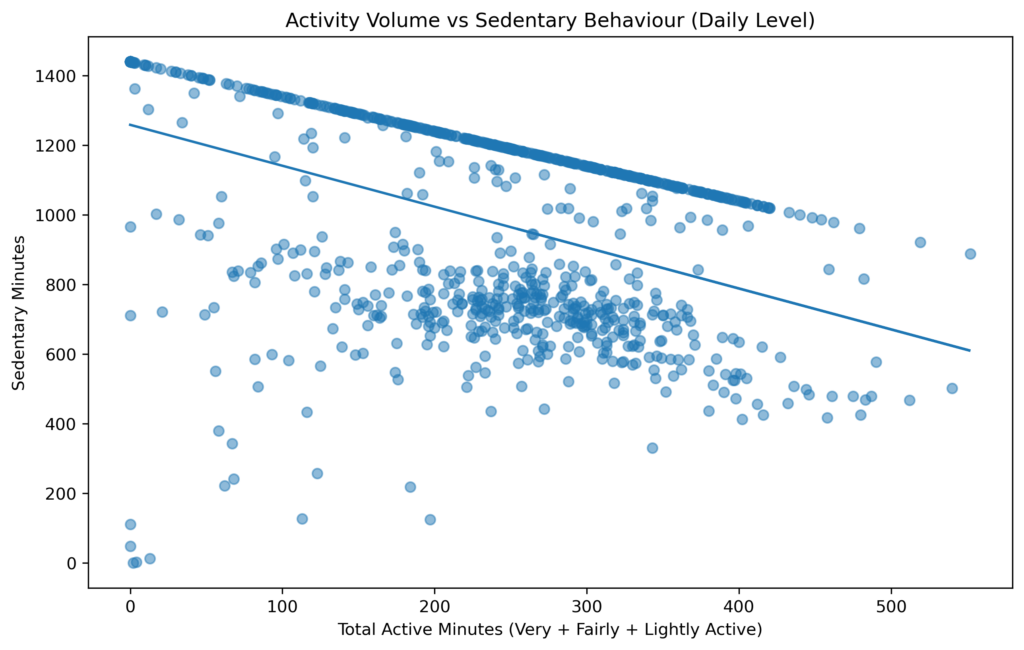
Figure 1. Daily-level relationship between Total Active Minutes (VeryActiveMinutes + FairlyActiveMinutes + LightlyActiveMinutes) and SedentaryMinutes, showing a consistent but moderate downward trend with visible behavioural variability.
4.3 A Moderate Activity Pattern with Diminishing Returns
Segmenting observations into low, medium, and high activity volume groups revealed a substantial reduction in sedentary minutes between the low and medium activity groups, with a smaller marginal decrease between medium and high activity levels. This pattern suggests that the most meaningful behavioural shift occurs when moving from low to moderate daily movement, while additional increases in activity yield diminishing reductions in sedentary time.
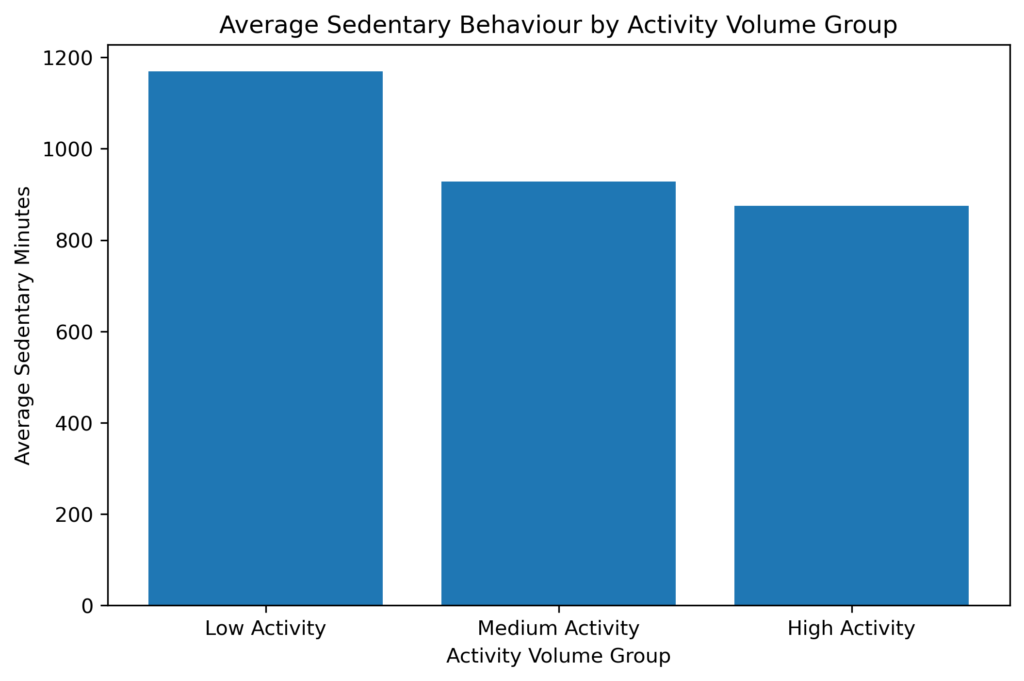
Figure 2. Average SedentaryMinutes across activity volume tertiles derived from TotalActiveMinutes, showing the largest behavioural reduction between low and medium activity groups and smaller marginal improvements at higher activity levels.
4.4 Within-Person Behavioural Patterns
Within-person comparisons showed that higher-than-usual activity days were associated with increased calorie expenditure and reductions in SedentaryMinutes relative to each individual’s baseline, while TotalMinutesAsleep remained comparatively stable. This suggests that short-term increases in activity more directly influence movement and energy expenditure than sleep duration.
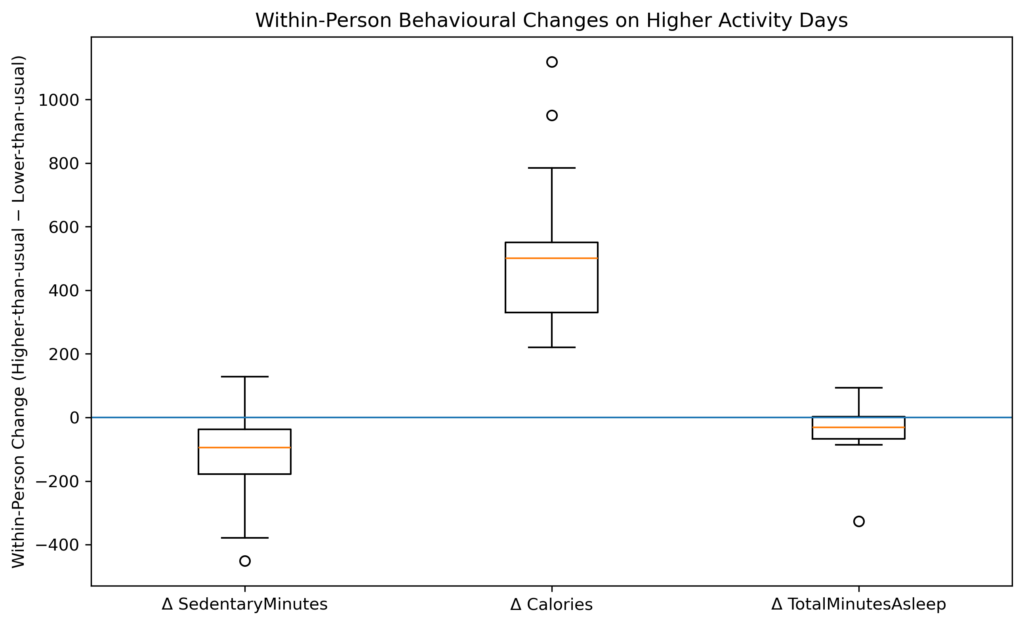
Figure 3. Within-person changes in SedentaryMinutes, Calories, and TotalMinutesAsleep on higher-than-usual activity days relative to each individual’s baseline. The median reduction in SedentaryMinutes and increase in Calories indicate consistent behavioural shifts with increased activity, while sleep duration remains relatively unchanged.
5. Interpretation and Behavioural Implications
Taken together, the findings indicate that total activity volume and distribution across the day are more meaningful behavioural indicators than intensity alone. SedentaryMinutes appear to be shaped less by activity intensity classification and more by the consistency of movement throughout the day.
From a behavioural and product perspective, this suggests that encouraging sustainable, distributed daily movement may be more effective than focusing exclusively on high-intensity activity targets. The results support a time-budget interpretation of health behaviour, where activity, sedentary time, and sleep function as interdependent components of a finite daily cycle.
6. Limitations and Future Directions
This analysis relied on aggregated daily metrics, which provide a broad behavioural overview but do not capture intra-day activity distribution. Higher-resolution Fitbit signals, such as minute-level activity and heart rate data, were not incorporated in this phase.
Future analysis could integrate higher-frequency signals to better understand activity timing, physiological effort, and micro-patterns of sedentary interruption, allowing for a more granular interpretation of behavioural dynamics.
7. Technical Stack
Technical Stack
Python (Pandas, Matplotlib)
Jupyter Notebook
Google BigQuery
Kaggle (full notebook and visual analysis)
Link to Full Notebook
View the full technical notebook (code + charts) on Kaggle:
https://www.kaggle.com/visionarydespot